May 2021 Real Estate Snapshot

 
View the Full Market Trends Report

April 2021 in the Greater Denver Metro housing market showed that the blatant hyper-demand in the residential housing industry continues to result in historic low months end inventory, even with months-end active inventory increasing by 35.03 percent. Altogether, there were still only 2,594 active properties at the end of the month, representing the lowest April on record and 48.38 percent less inventory than the previous April low in 2015.

As one reflects on this month's market trends report, it is important to remember where the market was this time last year. April 2020 was a month of confusion, fear and uncertainty for the world. The ebbs and flow of being an “essential” worker were reflected in new listings last year, which were down 43.02 percent compared to April of this year. 

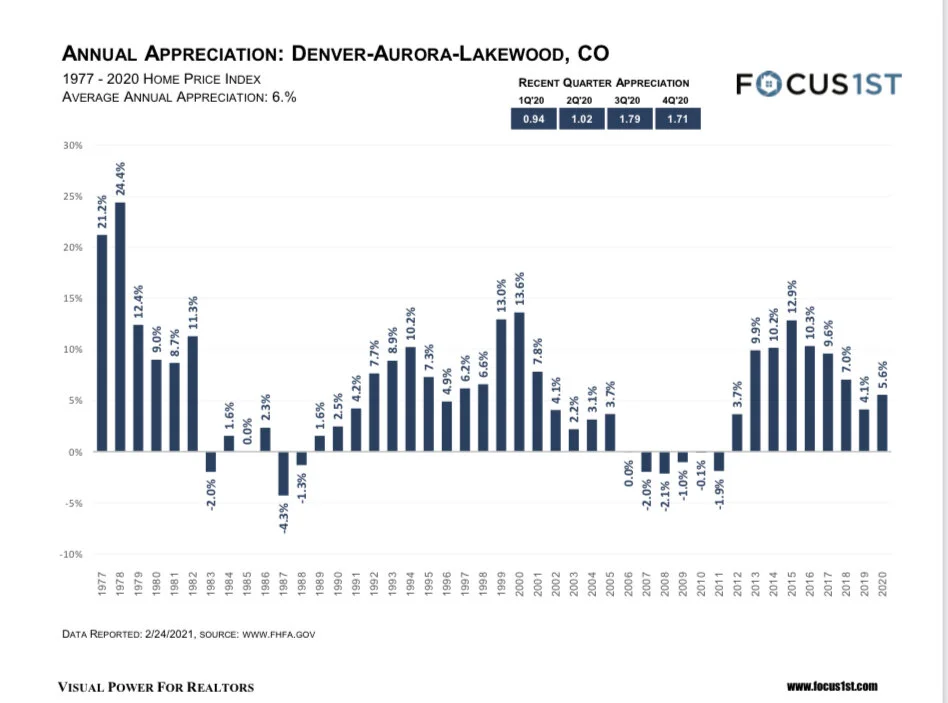
Since last year, the market has seen a steady rise in competition and therefore prices have as well. With only two weeks of inventory, year-over-year appreciation continues to be both staggering for the market while also bringing home sellers inevitably great returns, increasing 24.20 percent in April. 

“This April, the attached market saw a month-over-month appreciation of 7.30 percent, while the detached market saw an increase of 4.28 percent,” said Andrew Abrams, Chair of the DMAR Market Trends Committee and Metro Denver REALTOR®. “The explanation for these statistics could be as simple as the attached market has a more approachable price point. The average purchase price of a single-family detached property in the Greater Denver Metro area is $699,039. With prices on the rise, education, strategy and expectations have never been more critical for a buyer approaching this market.”

Our monthly report also includes statistics and analyses in its supplemental “Luxury Market Report” (properties sold for $1 million or greater), “Signature Market Report” (properties sold between $750,000 and $999,999), “Premier Market Report” (properties sold between $500,000 and $749,999), and “Classic Market” (properties sold between $300,000 and $499,999).

April showed no signs of slowing down in the Luxury Market with some interesting trends at hand. Overall, the Luxury Market has experienced more growth than any other segment. In 2018, 2019 and 2020, year-to-date closed sales of properties over $1 million were 649, 654 and 661, respectively. So far, in 2021, there have been 1,353 closed sales, more than double the number of the past three years. The median days in MLS for the Luxury Market was seven, down from 23 in 2020, 22 in 2019, 32 in 2018 and 48 in 2017. 

Luxury Market closed sales in April 2020 were contracted before the shutdown, and on average, sold for 97.61 percent of list price. This April, buyer demand has pushed that number to 102.43 percent of list price, nearly five percent more than last year showing not an inventory crisis but a hyper-demand that has increased the speed at which the market operates and the prices that homes transact.

“Year-over-year data for April 2021 is difficult to reconcile for the Luxury Market given the numbers last year as the pandemic raged,” said Taylor Wilson, DMAR Market Trends Committee member and metro Denver REALTOR®. “What we do know is that the Luxury Market is changing, and those who pivot quickly will capitalize on the opportunities that still exist: low interest rates, a strong economy and a low price to build a home. Fast, aggressive offers with strong financing will continue to be the path to success in the Luxury Market.”

Historically, the market has seen annual inventory reach its low point in February and March, followed by increased listing activity until we hit our inventory peak in August and September. The Luxury Market appears to follow the trend with 28.82 percent more new listings in April than March, showing that it may be possible for buyers who outlast the fatigue of competition to find themselves with more options than they have seen in the past few months. If so, with only one month of inventory for attached homes and 1.97 months for attached homes, buyers will need to keep their feet on the gas to win.

The DMAR Market Trends Committee releases reports monthly, highlighting important trends and market activity emerging across the Denver metropolitan area. Reports include data for Adams, Arapahoe, Boulder, Broomfield, Clear Creek, Denver, Douglas, Elbert, Gilpin, Jefferson and Park counties. Data for the report was sourced from REcolorado® (April 1, 2021) and interpreted by DMAR.

Denver Appreciation Graph Since 1977

 
image0 (17).jpeg

This data shows the appreciation over the last [40] years for the [appreciation chart area] area. It is based on data collected by the government based on every home sold or refinanced. The government estimates the appreciation based on when homes were originally purchased, and for what they were recently appraised for. [Many other appreciation estimates are based on the average home sold. This can create inaccurate estimates especially in areas where higher priced homes are selling and when there is lots of new construction.] This chart may not be your exact area, but it may give you an idea on what your appreciation may be. As you can see, [discuss the appreciation over time, and point out the recent appreciation/depreciation].

April 2021 Real Estate Snapshot

 
Click HERE For The Full Market Trends Report

In March, the Greater Denver Metro housing area displayed itself as an emotional market, with nearly every statistic in the report justifying how much competition there is for buyers as well as how far they are willing to take their offers to secure a home. 

Year-over-year appreciation is at 15.26 percent from $511,511 to $589,587 this March, while month-over-month appreciation is at 6.90 percent from $551,542. On par with recent months, median days in the MLS went down to four, while close-price-to-list-price ratio went up to 103.32 percent. Whether looking at detached or attached properties, it is a strong seller's market across the board.

“In a highly emotional market, it is one of the most challenging times to hone in on a price,” said Andrew Abrams, Chair of the DMAR Market Trends Committee and Metro Denver REALTOR®. “Instead of only using past sales as an indicator, one must also understand how much competition one has when submitting an offer. In other words: the data or facts are only a small piece of the puzzle. The bigger question is what are buyers willing to offer to beat out their competitors and go under contract?”

Theoretically, this month’s report shows that if a buyer waited just one month to buy a $500,000 property from the end of February to the end of March, they would have had to pay $35,000 more for that property.

Abrams continued, “As interest rates start to trickle up, prices continue to rise, and inventory continues to shrink, other consistent questions become whether the market is in a bubble and if now is a good time to buy? If you use supply and demand as a metric for the “bubble” question, it would be difficult to think that we are in one.” 

Our monthly report also includes statistics and analyses in its supplemental “Luxury Market Report” (properties sold for $1 million or greater), “Signature Market Report” (properties sold between $750,000 and $999,999), “Premier Market Report” (properties sold between $500,000 and $749,999), and “Classic Market” (properties sold between $300,000 and $499,999).

As we enter the spring selling season, new listings in the Luxury Market are unable to keep up with buyer demand, in part because the report shows that as prices and appreciation continue to soar, more homes cross the threshold into the Luxury Market as a result.

New detached listings increased 28.03 percent with 402 new listings, up from 314 last month. This barely kept pace with the pending sales topping out at 399, a 26.27 percent increase month over month. As a result, sales volume was also up month-over-month 57.43 percent reflecting $558,253,910 at month-end. 

Year-to-date detached new listings were up 4.23 percent from 923 last year to 962. Pending sales skyrocketed 95.98 percent year-over-year clocking in at 974, outpacing new listings hitting the market. In turn, closed sales were up 70.88 percent with 757 closed detached homes, up from 443 last year resulting and sales volume increased 79.15 percent to $1,230,567,497. Median days in MLS dropped to just 11, which is a record low for this market and the close-price-to-list-price ratio came in at 99.88 percent, representing a small 3.12 percent increase from last year. 

“In the January report, I shared that the luxury attached market was a segment of the market where deals could be found, but it appears the secret is out,” said Libby Levinson, DMAR Market Trends Committee member and metro Denver REALTOR®. “Sales volume for the attached segment of the market is up 62.63 percent year-over-year to $64,182,709 and up 63.56 percent month-over-month from last month’s $39,240,156. As volume has gone up, median days in MLShas fallen from 27 days last year and even a whopping 35 days in February to only seven days in the month of March.”

The median days in MLS in March mirrored the detached segment of the market which currently lands at six days. Year-to-date the median days on market in 2019 was 63, and in 2020, it was 53, while 2021 is currently sitting at ten days. 

The DMAR Market Trends Committee releases reports monthly, highlighting important trends and market activity emerging across the Denver metropolitan area. Reports include data for Adams, Arapahoe, Boulder, Broomfield, Clear Creek, Denver, Douglas, Elbert, Gilpin, Jefferson and Park counties. Data for the report was sourced from REcolorado® (April 1, 2021) and interpreted by DMAR.

Source: https://www.dmarealtors.com/sites/default/...