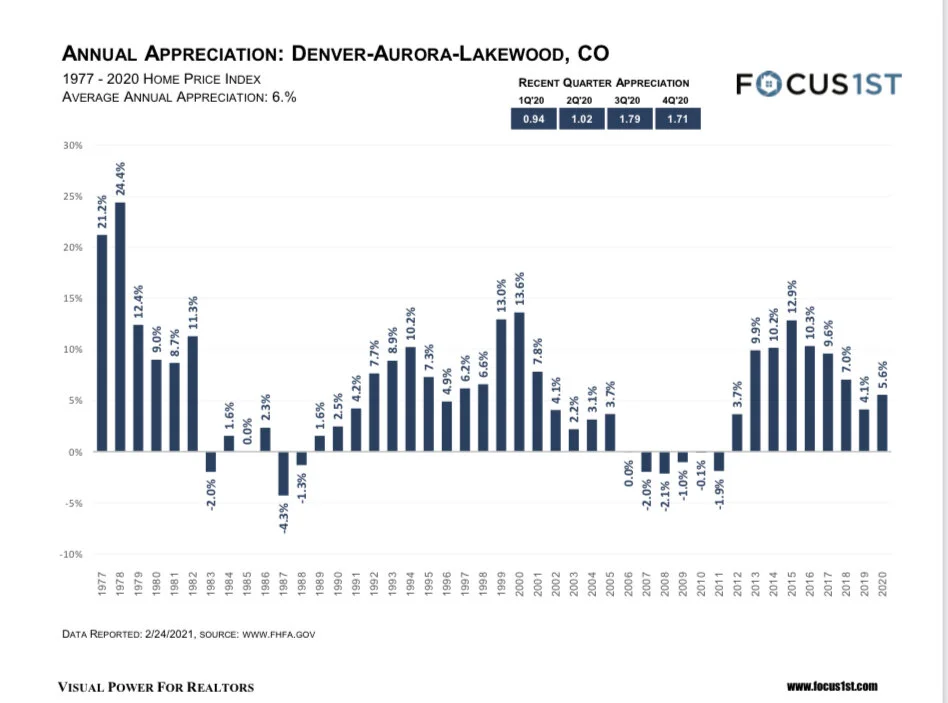
This data shows the appreciation over the last [40] years for the [appreciation chart area] area. It is based on data collected by the government based on every home sold or refinanced. The government estimates the appreciation based on when homes were originally purchased, and for what they were recently appraised for. [Many other appreciation estimates are based on the average home sold. This can create inaccurate estimates especially in areas where higher priced homes are selling and when there is lots of new construction.] This chart may not be your exact area, but it may give you an idea on what your appreciation may be. As you can see, [discuss the appreciation over time, and point out the recent appreciation/depreciation].
April 2021 Real Estate Snapshot

In March, the Greater Denver Metro housing area displayed itself as an emotional market, with nearly every statistic in the report justifying how much competition there is for buyers as well as how far they are willing to take their offers to secure a home.
Year-over-year appreciation is at 15.26 percent from $511,511 to $589,587 this March, while month-over-month appreciation is at 6.90 percent from $551,542. On par with recent months, median days in the MLS went down to four, while close-price-to-list-price ratio went up to 103.32 percent. Whether looking at detached or attached properties, it is a strong seller's market across the board.
“In a highly emotional market, it is one of the most challenging times to hone in on a price,” said Andrew Abrams, Chair of the DMAR Market Trends Committee and Metro Denver REALTOR®. “Instead of only using past sales as an indicator, one must also understand how much competition one has when submitting an offer. In other words: the data or facts are only a small piece of the puzzle. The bigger question is what are buyers willing to offer to beat out their competitors and go under contract?”
Theoretically, this month’s report shows that if a buyer waited just one month to buy a $500,000 property from the end of February to the end of March, they would have had to pay $35,000 more for that property.
Abrams continued, “As interest rates start to trickle up, prices continue to rise, and inventory continues to shrink, other consistent questions become whether the market is in a bubble and if now is a good time to buy? If you use supply and demand as a metric for the “bubble” question, it would be difficult to think that we are in one.”
Our monthly report also includes statistics and analyses in its supplemental “Luxury Market Report” (properties sold for $1 million or greater), “Signature Market Report” (properties sold between $750,000 and $999,999), “Premier Market Report” (properties sold between $500,000 and $749,999), and “Classic Market” (properties sold between $300,000 and $499,999).
As we enter the spring selling season, new listings in the Luxury Market are unable to keep up with buyer demand, in part because the report shows that as prices and appreciation continue to soar, more homes cross the threshold into the Luxury Market as a result.
New detached listings increased 28.03 percent with 402 new listings, up from 314 last month. This barely kept pace with the pending sales topping out at 399, a 26.27 percent increase month over month. As a result, sales volume was also up month-over-month 57.43 percent reflecting $558,253,910 at month-end.
Year-to-date detached new listings were up 4.23 percent from 923 last year to 962. Pending sales skyrocketed 95.98 percent year-over-year clocking in at 974, outpacing new listings hitting the market. In turn, closed sales were up 70.88 percent with 757 closed detached homes, up from 443 last year resulting and sales volume increased 79.15 percent to $1,230,567,497. Median days in MLS dropped to just 11, which is a record low for this market and the close-price-to-list-price ratio came in at 99.88 percent, representing a small 3.12 percent increase from last year.
“In the January report, I shared that the luxury attached market was a segment of the market where deals could be found, but it appears the secret is out,” said Libby Levinson, DMAR Market Trends Committee member and metro Denver REALTOR®. “Sales volume for the attached segment of the market is up 62.63 percent year-over-year to $64,182,709 and up 63.56 percent month-over-month from last month’s $39,240,156. As volume has gone up, median days in MLShas fallen from 27 days last year and even a whopping 35 days in February to only seven days in the month of March.”
The median days in MLS in March mirrored the detached segment of the market which currently lands at six days. Year-to-date the median days on market in 2019 was 63, and in 2020, it was 53, while 2021 is currently sitting at ten days.
The DMAR Market Trends Committee releases reports monthly, highlighting important trends and market activity emerging across the Denver metropolitan area. Reports include data for Adams, Arapahoe, Boulder, Broomfield, Clear Creek, Denver, Douglas, Elbert, Gilpin, Jefferson and Park counties. Data for the report was sourced from REcolorado® (April 1, 2021) and interpreted by DMAR.
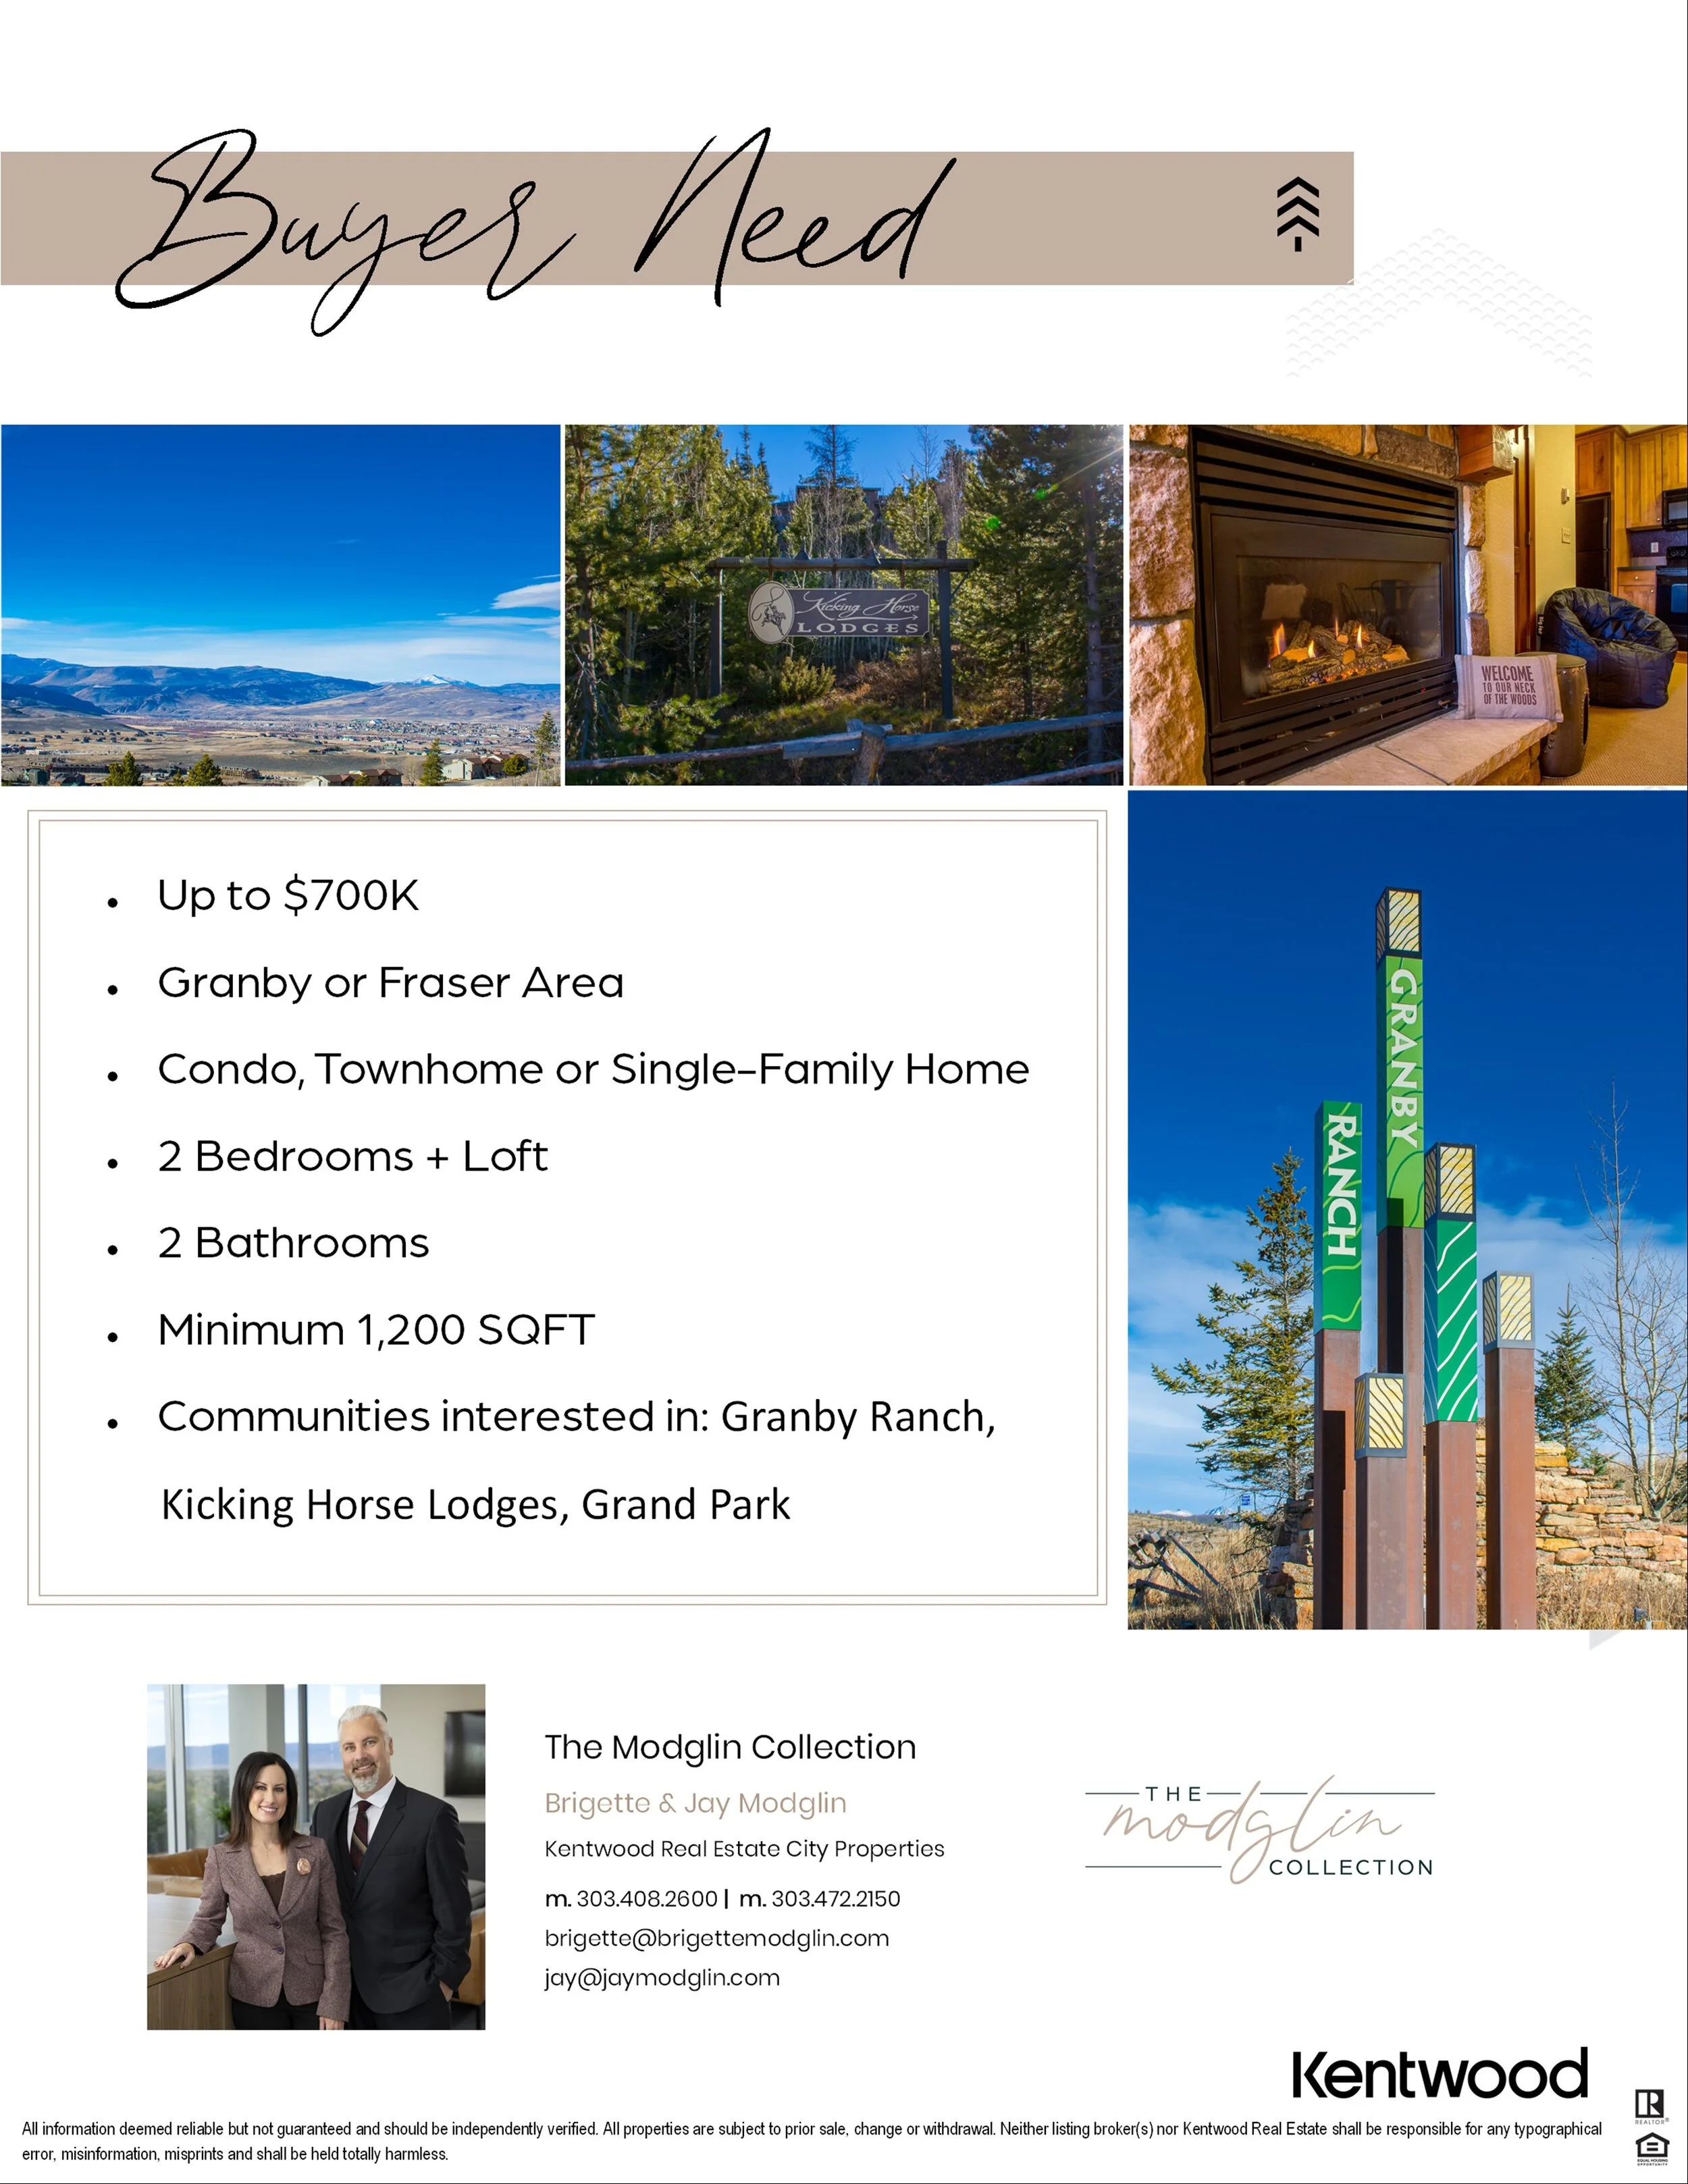
Buyer Need In Grand County, CO
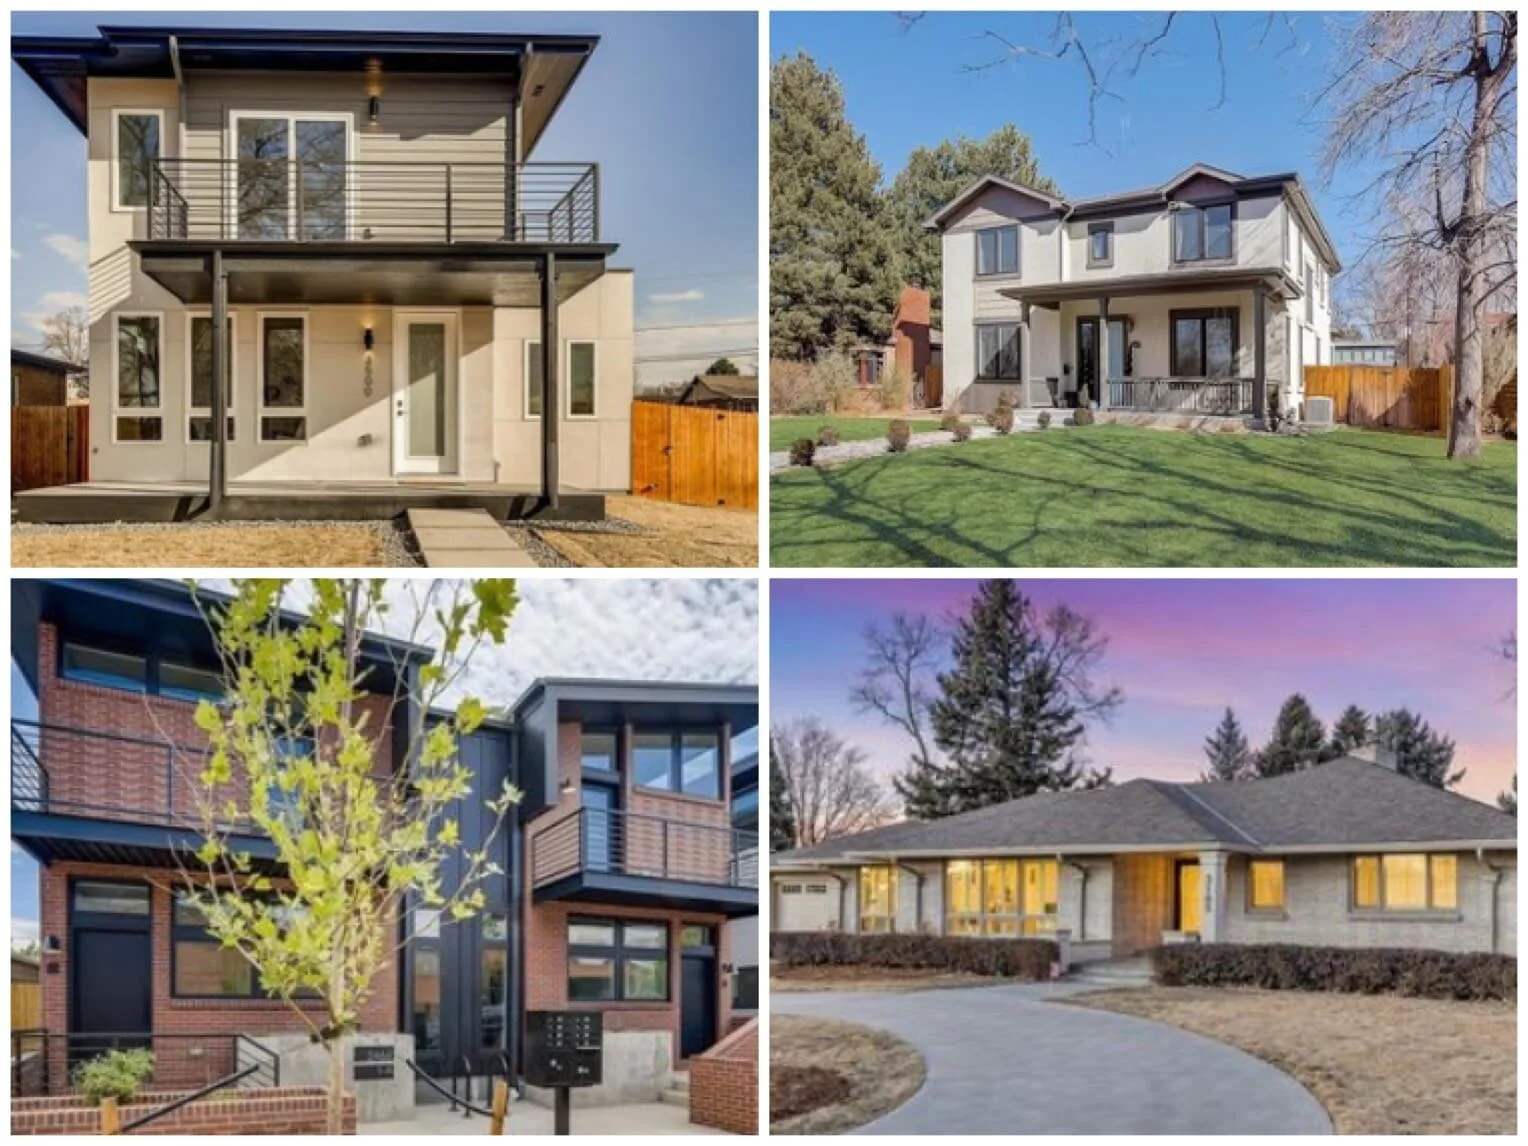
Photos provided by: @ReColorado
Which Denver neighborhoods got hot in 2020?
It’s no secret that Denver’s housing market had one of its most competitive years in 2020. Home prices skyrocketed, thanks to low interest rates and inventory.
But what neighborhoods truly had a breakthrough in 2020?
Places like Wash Park and Cherry Creek have been scorching hot for decades. But a new report compiled by Land Title Guarantee Co. provides some insights on the neighborhoods where the housing market was most different last year than 2019.
Landing in the top five were a couple of transitioning neighborhoods that offer a relatively affordable price point without getting too far from downtown, as well as a handful of traditional residential enclaves that lack the name brand of Denver’s ritzier neighborhoods:
Specifically, the top five for detached single-family homes were:
Clayton (80205)
Montclair (80220)
Overland (80110)
University (80210)
Wellshire (80210)
Land Title researched each 2020 home sale across every neighborhood in Denver, and compiled the report in January. The company used year-over-year sales volume, price per square foot, and average sales price as guidelines.
“This is the first time we have been able to compile this list in an accurate way since this comes from public record data, so it’s a full look at the market,” said Jim Renshaw, senior vice president of Land Title. “Denver County is fairly tricky in how it’s laid out from a subdivision standpoint.”
To reach the top five list, Land Title focused on neighborhoods that saw more than a 25 percent increase in the units sold, as well as a more than 9 percent increase in the average sales price, according to Land Title sales agent Harrison Stadnik.
“The Denver market is just so competitive right now that it was difficult to whittle it down,” Stadnik said. “We could have used the average price per square foot increases, but the closing price statistic was more compelling, and overall, these two were the most objective.”
Breaking down the top five
Clayton, which is two and a half miles north of City Park, had a nearly 45 percent increase in units sold, from 47 in 2019 to 68 in 2020. The average closing price increased 10 percent, to $483,829.
Brigette Modglin, a broker associate for Kentwood Real Estate who has been working in Colorado for more than 20 years, said homebuyers are being forced to look outside the typical “hot” neighborhoods, like Wash Park and the Highlands, due to rising prices. She added that some listings are being sold for 20 percent more than their list price.
“I’ve sold there, and it comes down to affordability,” Modglin said of Clayton. “It’s not that far from (downtown) Denver and there’s a lot of building happening there. Developers are looking over there because the land is more affordable and there are light rail stations nearby to attract newcomers.”
Montclair, which is north of Hilltop, saw a 26 percent increase in units sold, from 119 in 2019 to 150 in 2020. The average closing price increased nearly 20 percent, to $765,494.
“Neighborhoods like Wash Park are so expensive and there’s not a lot of land left unless you scrape a home or pop the top off, so I’m not surprised people are turning to different neighborhoods that maybe weren’t on their wish list before,” Modglin said. “If they want to buy, they need to look outside those hot areas to get into a home.”
Overland, which is on the west side of South Broadway near Rosedale and Platt Park, had an 80 percent increase in units sold, from 25 in 2019 to 45 in 2020. The average closing price increased by 17 percent, reaching $462,644.
Courtney Ranson, an agent with Milehimodern who has been working in Colorado for 16 years, agreed that new developments and land affordability in the area attracted new homebuyers.
“I have a buyer specifically targeting that neighborhood predominantly because of the growth in construction. Comparatively speaking, he can get so much more with what he can sell his West Wash Park home for,” Ranson said.
Article by: Business Den
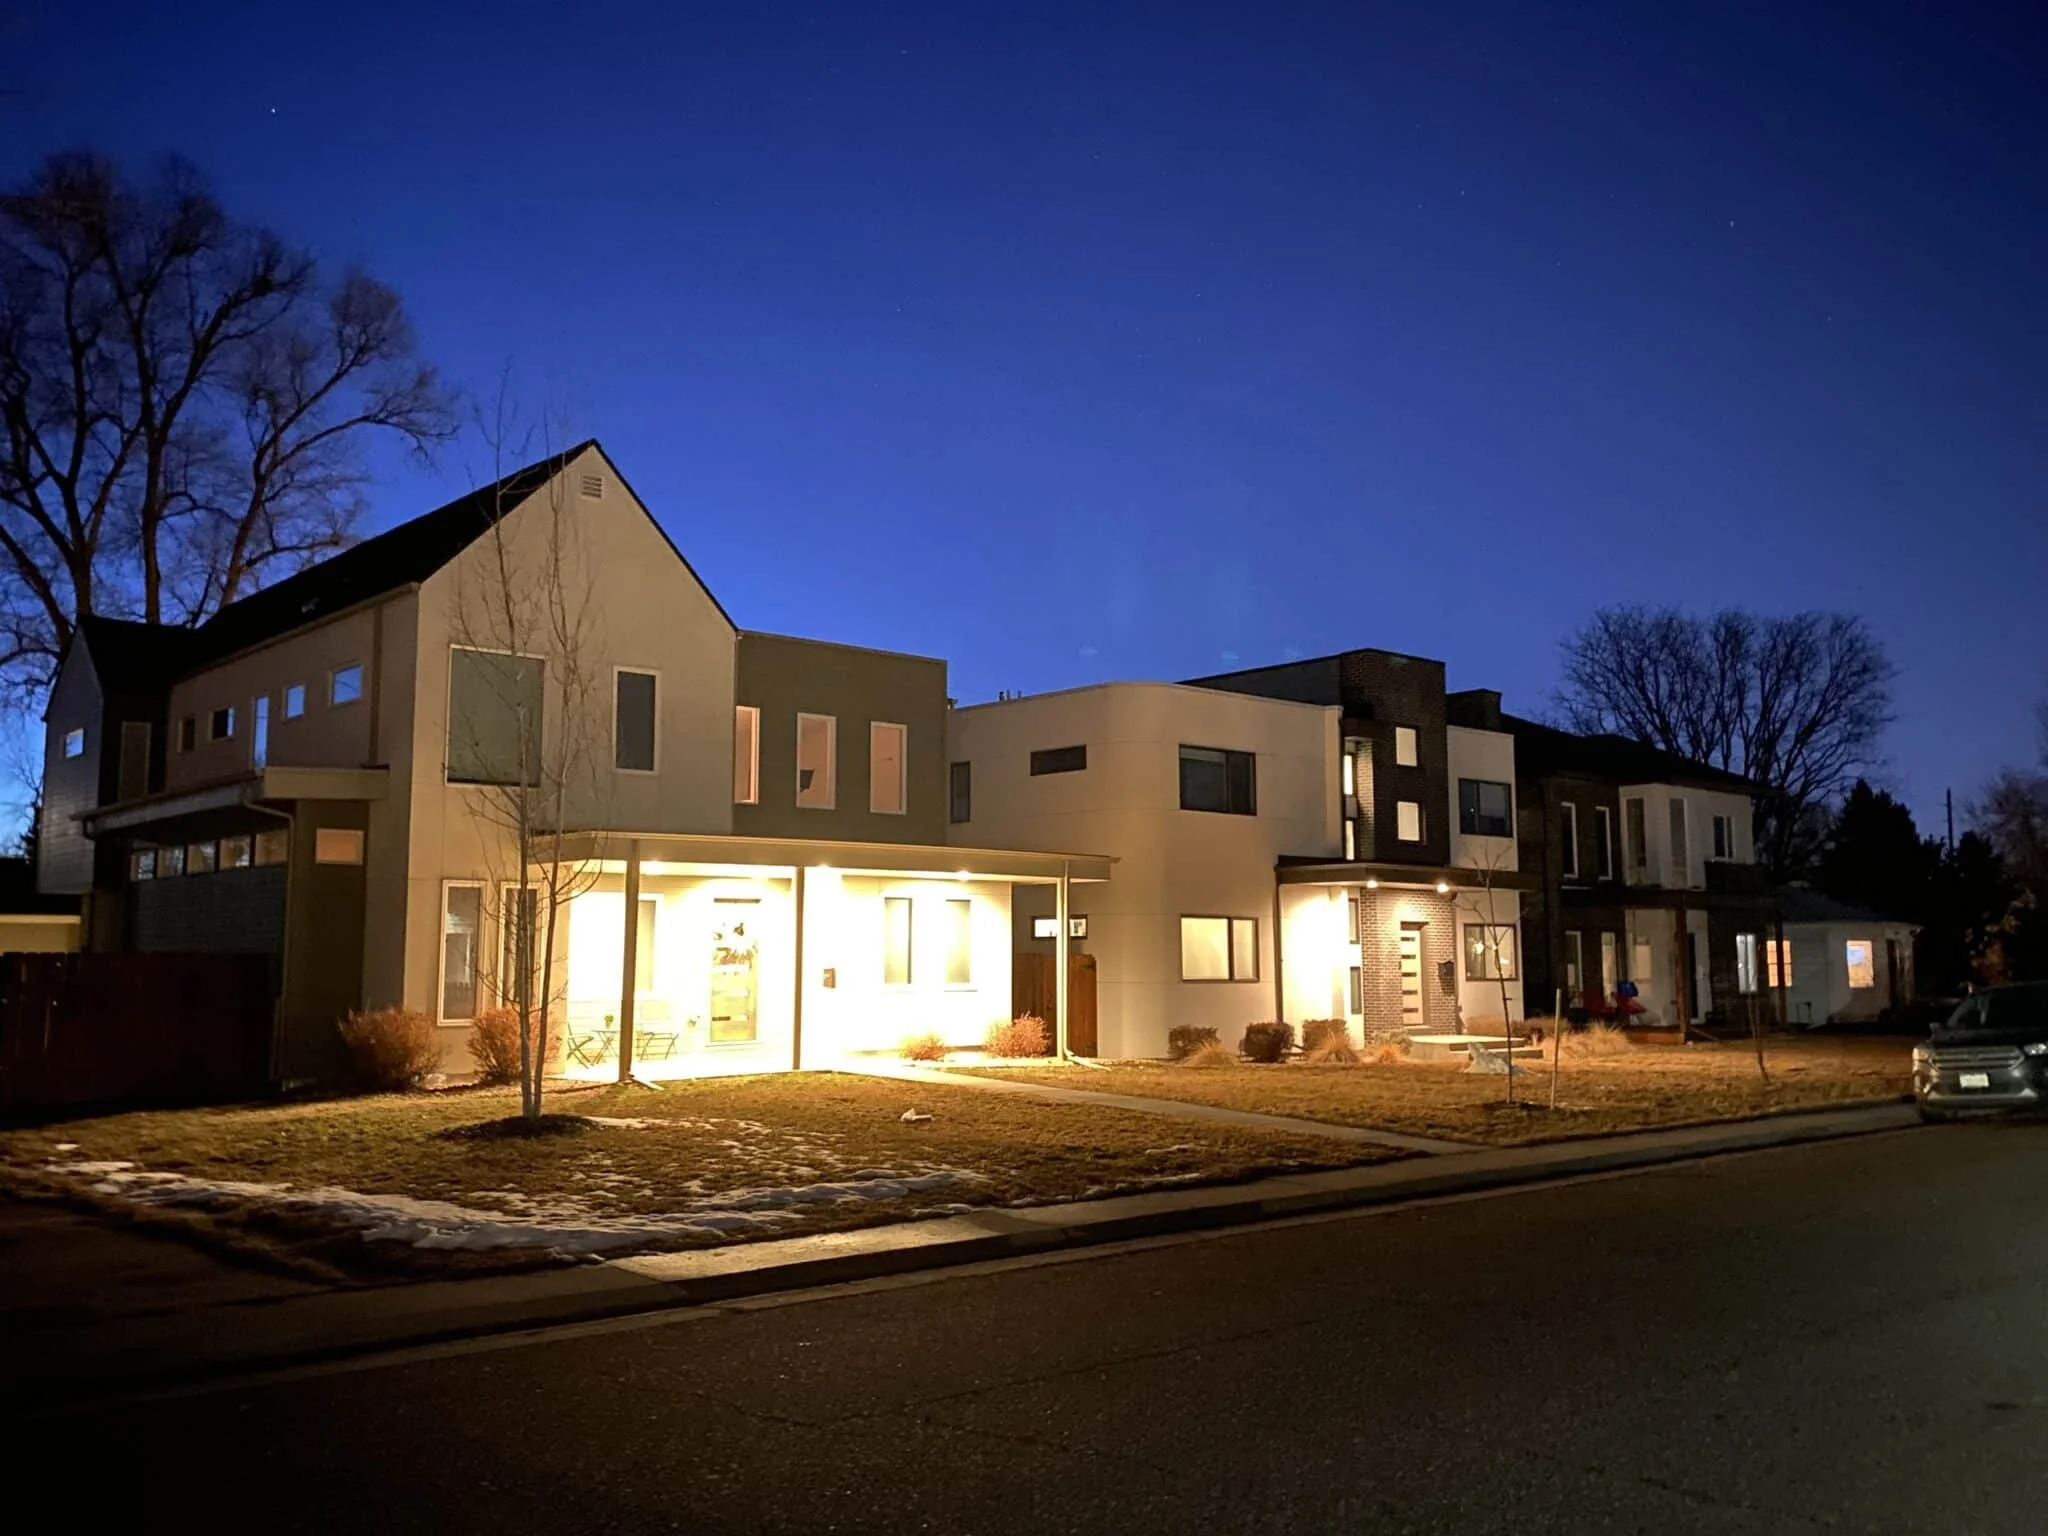
University saw a 57 percent increase in homes sold last year, from 103 in 2019 to 162 in 2020. (Lily O’Neill photo)
On the other side of South Broadway, University saw a 57 percent increase in units sold, from 103 in 2019 and 162 in 2020. There was also a 9.2 percent increase in the average closing price, to $649,963.
“These neighborhoods are reaching their potential,” Land Title agent Stadnik said. “University’s price point is more approachable, and it saw a huge jump in closed units. It’s a safe place to buy, where you’ll still see some appreciation.”
On the higher end of the price spectrum is Wellshire, which had a 48 percent increase in units sold, from 50 in 2019 to 74 in 2020. It also saw a 9.8 percent increase in the average closing price, reaching $811,598.
“I’m not surprised Wellshire made the list because it’s such a great neighborhood with bigger lots that I’m sure people flocked to during the pandemic for more breathing room,” Ranson said. “There’s such a mass migration out of the downtown market, and these emerging neighborhoods are being redefined by first-time homebuyers.”
Other honorable mentions:
Berkeley was also trending throughout 2020. The northwest neighborhood saw a 13.6 percent increase in average closing price, which was $715,098, and an 18 percent increase in units sold from 167 in 2019 to 197 in 2020.
And Lincoln Park had the largest increase in average price per square foot with a 17.6 percent jump, but it sold 10 less units in 2020 than it did the previous year.
“Until we get this inventory crisis squared away, I think anything is going to sell, even if it’s lipstick on a pig,” Ranson said. “It’s a tough market right now, and I don’t see anything changing drastically unless there’s some act of God.”
For those interested in a look into Denver’s priciest neighborhoods, here’s how they did in 2020:
Cherry Creek saw a nearly 53 percent increase in units sold, from 17 in 2019 to 26 in 2020. But the average closing price decreased 23 percent, to $1.75 million.
Wash Park, which Stradnik said was experiencing a bit of “a plateau” compared to previous years, increased units sold by 33 percent, with 147 in 2019 and 196 in 2020. The average closing price increased by 6.5 percent to $1.36 million
Hilltop saw a 17 percent increase in units last year, growing from 153 in 2019 to 180 in 2020. The average closing price increased by 9.5 percent to $1.4 million.

Finding a New House to Launch Your Business
While a home-based business can be convenient and help you save on renting office space, it’s vital to have enough space to make it work. If you’re planning on moving at the same time as your business launch, use this guide to help you manage the tasks ahead. And if you’re deep into house-hunting and need some help, contact Brigette Modglin.
Finding the right house
When you’ve decided to run a business out of your home, it’s important to take a hard look at your current home to see if it’s the right fit for your needs. If you don’t have a place in your home that you can use as a dedicated workspace — a spare bedroom, for example — it’s probably time to look for a new house.
When you’re looking for the right house to suit your needs, consider the functions of your business to help you establish what elements of a house will help you launch your business. For example, if you plan to see clients for your new business, it’s a great idea to find a house that
has a room with a separate entrance. Not only will that provide privacy for your client, but it will also keep your personal life separate from your business.
Another factor to consider is whether you’ll need additional storage for your new business. If you’re starting an online retail company, it’s likely you’ll have inventory that you’ll need to store. Consider finding a home that has ample storage, whether it’s a garage or a basement that’s easy to access.
Once you determine your needs, make a list of non-negotiables that will help you in your house-hunt. Knowing your non-negotiables will help you rule out homes that aren’t right for your needs, and will help speed up your home search. Brigette Modglin can provide you with guidance during this step and every other aspect of the process.
Running your business during a move
When you’ve found the right home, it could be tricky to manage your business while moving house. Before you start the move, consider what tasks you can set aside in the weeks it takes to get out of your old house and into the new house. If you’re just getting started, this could be a great time to get the paperwork out of the way.
One key task of launching a business is establishing a business structure. A popular option for many entrepreneurs is a limited liability company or LLC: not only does it provide protection for your personal assets, but it also has certain tax advantages.
Another great task to take care of during the move is procuring any office equipment or business supplies you’ll need when it comes time to set up your new workspace. Consider what type of desk you want — standing or sitting — and find a comfortable chair to keep your back healthy. It’s also wise to set up a strong internet connection that can handle the workload for you and your family.
Finally, you may want to consider setting aside time for earning a higher education to help you become a more successful business leader. Earning a master's degree in business administration can easily be done online, and this way, you'll have the flexibility to create a schedule that works for you. In other words, you can work on getting your degree without missing a beat with the moving process and business management.
Moving at the same time as setting up a new business will take some patience and creativity, but with the above tips, you’ll make it all work. Just be sure to find the right home for your business and personal needs, and find business tasks to accomplish while you’re between homes. Once you’re in the new home, then the real fun begins: set up your office to suit your working style and enjoy your new space.
Written by: Megan Cooper